Evidence coverage is not a single score
A comparison of support for the key and documented refutations of competing answers.
Two measurements, two directions
A six-test evaluation compared two configurations across three intended levels. Configuration A covered 188 multiple-choice items and configuration B covered 198. The analysis tracked both recorded refutations of incorrect options and recorded evidence supporting the key.
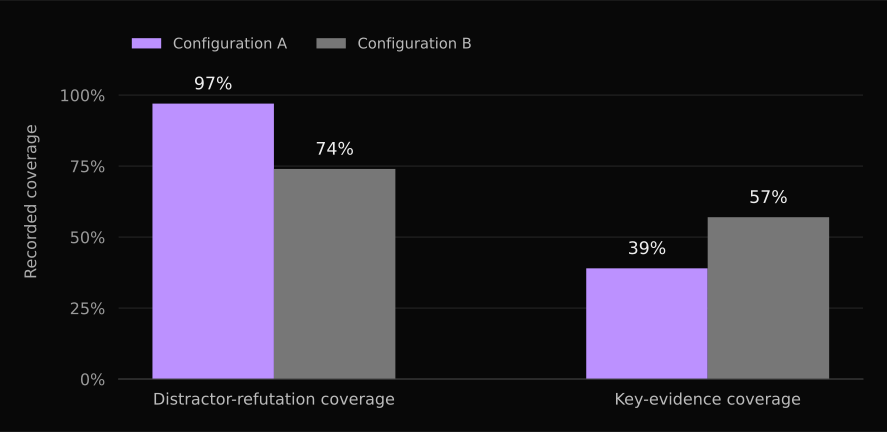
| Recorded measure | Configuration A | Configuration B | Difference: A − B |
|---|---|---|---|
| Distractor-refutation coverage | 97% | 74% | +23 percentage points |
| Key-evidence coverage | 39% | 57% | −18 percentage points |
The trade-off remains visible
Configuration A had higher recorded refutation coverage and lower recorded key-evidence coverage. Collapsing the two into one score would conceal that asymmetry. The evaluation keeps support for the key and exclusion of alternatives separate.
| Evaluation scope | Recorded sample |
|---|---|
| Full tests | 6 |
| Multiple-choice items | 386 |
| Distractors | 1,158 |
| Intended levels | 3 |
| Human response data | Not part of this study |
What coverage establishes
Coverage indicates that a corresponding evidence record is present. It does not, by itself, establish that the evidence is correct, the item is valid, or a distractor functions as intended for learners. The measurements also have different denominators: refutations concern incorrect options; key support concerns items. Their percentages should not be interpreted as directly interchangeable units.
Study record
Internal TOEFL-style assessment evaluation, June 2026, comparison table §4. A and B are anonymized configuration identifiers. Rates are rounded source values; counts per cell and confidence intervals are not supplied. This is a descriptive comparison of recorded assessment evidence, not a measured student-outcome claim.